Visualizing The Risk Of Running Out Of Money In Retirement


And when you plan your retirement, you can't afford to run out of money.
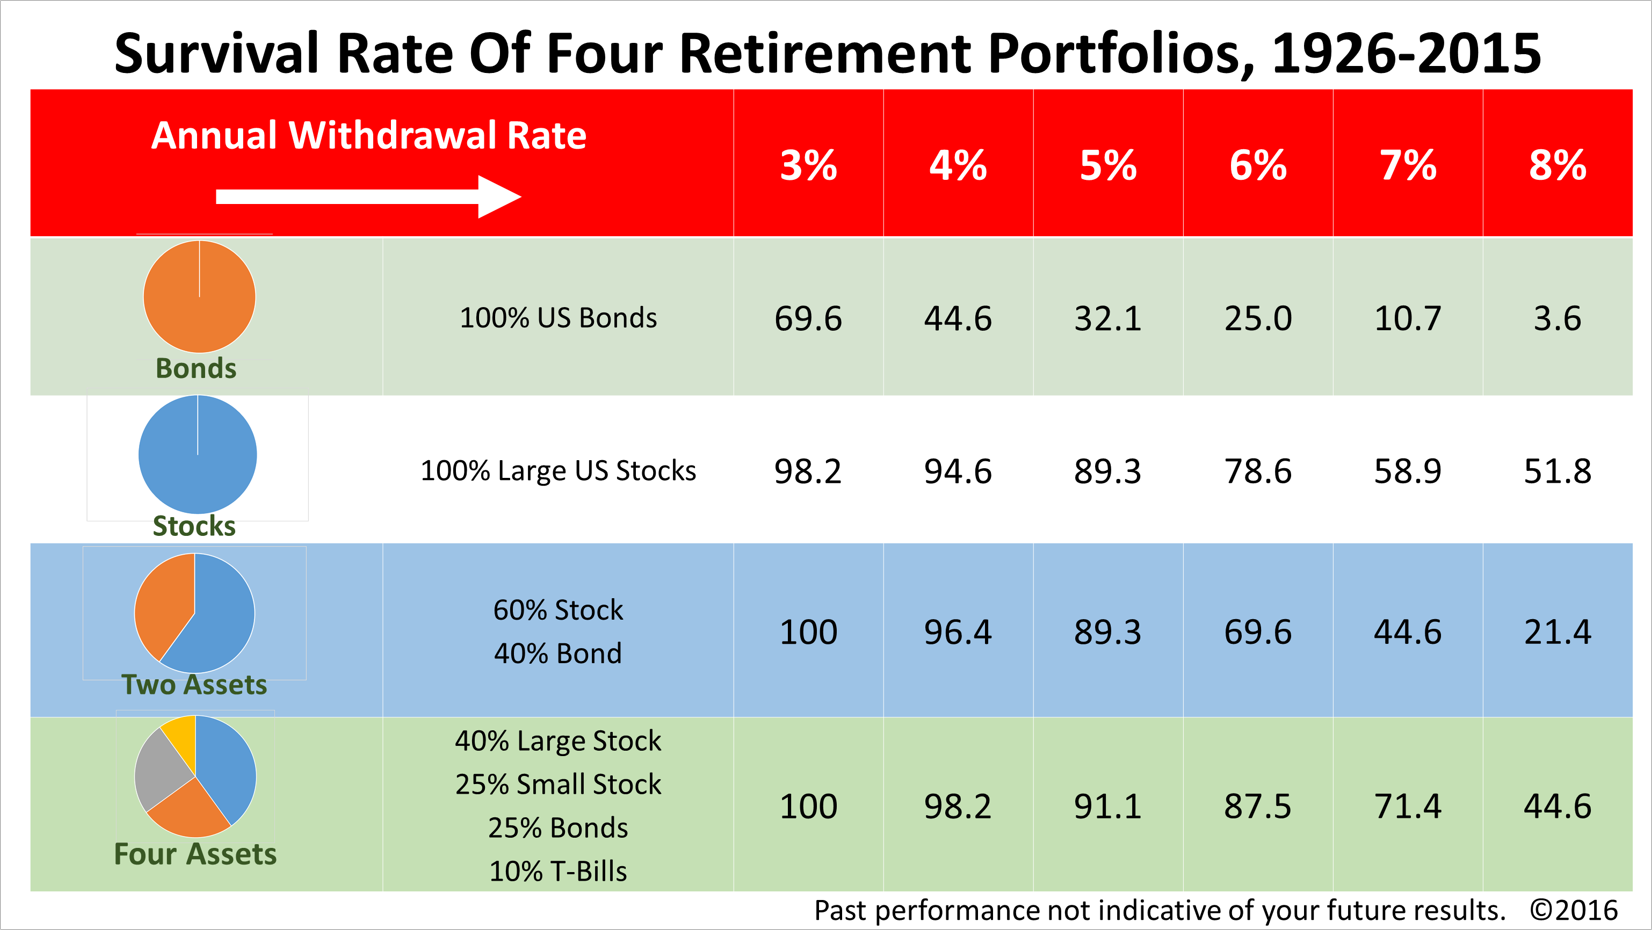
Israelsen back-tested the survival rates of four retirement portfolios based on 90 years of historical data.
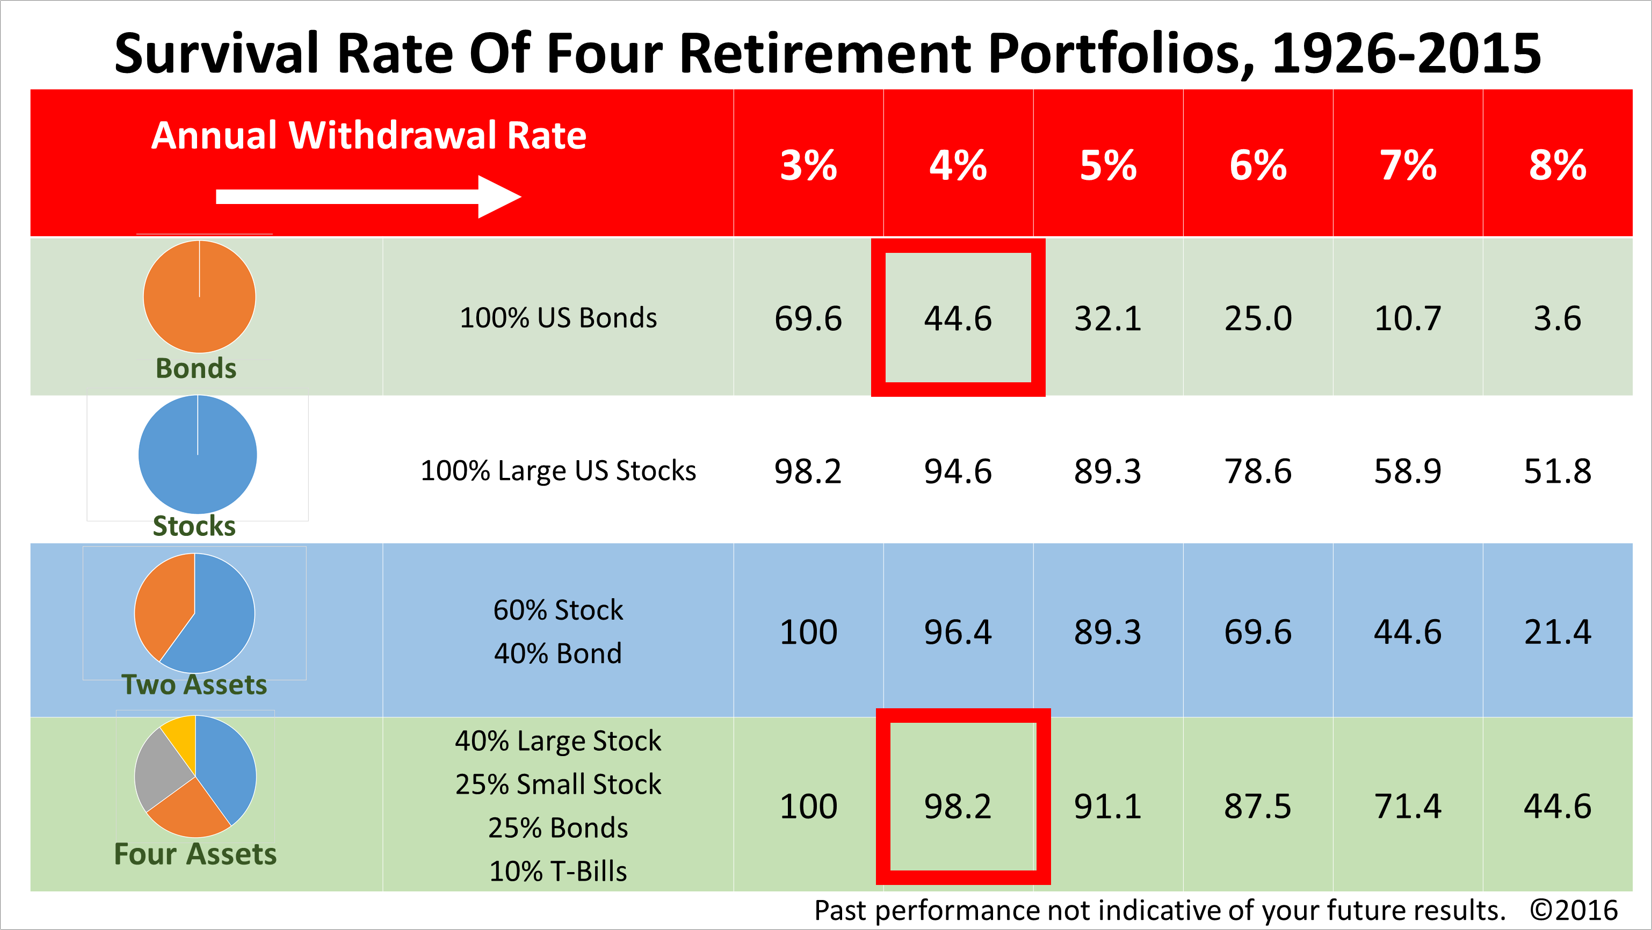
In contrast, a four-asset diversified retirement portfolio lasted at least 35 years 98.2% of the time.
To be clear, there were 56 rolling calendar-year 35-year periods between 1926 and 2015. The first 35-year period was from 1926 through 1960, the second was from 1927 to 1961, and so on.
The numbers in the table represent the percentage of time that these four retirement portfolios lasted at least 35 years over the past 90 years – after initial annual withdrawals of 3% to 8%, and 3% cost-of-living adjustments annually to keep up with inflation.
This table is the traditional way to illustrate the survival rates of different portfolios. While the table is very helpful, this is not the only way of visualizing your risk of running out of money in retirement, and it is not the best way.
What this table does NOT show is how long portfolios survived when they didn't last at least 35 years. You have no idea whether a portfolio that failed the 35-year test survived 34, 30, or only 20 years.
That's where this new way of visualizing your retirement portfolio comes in.
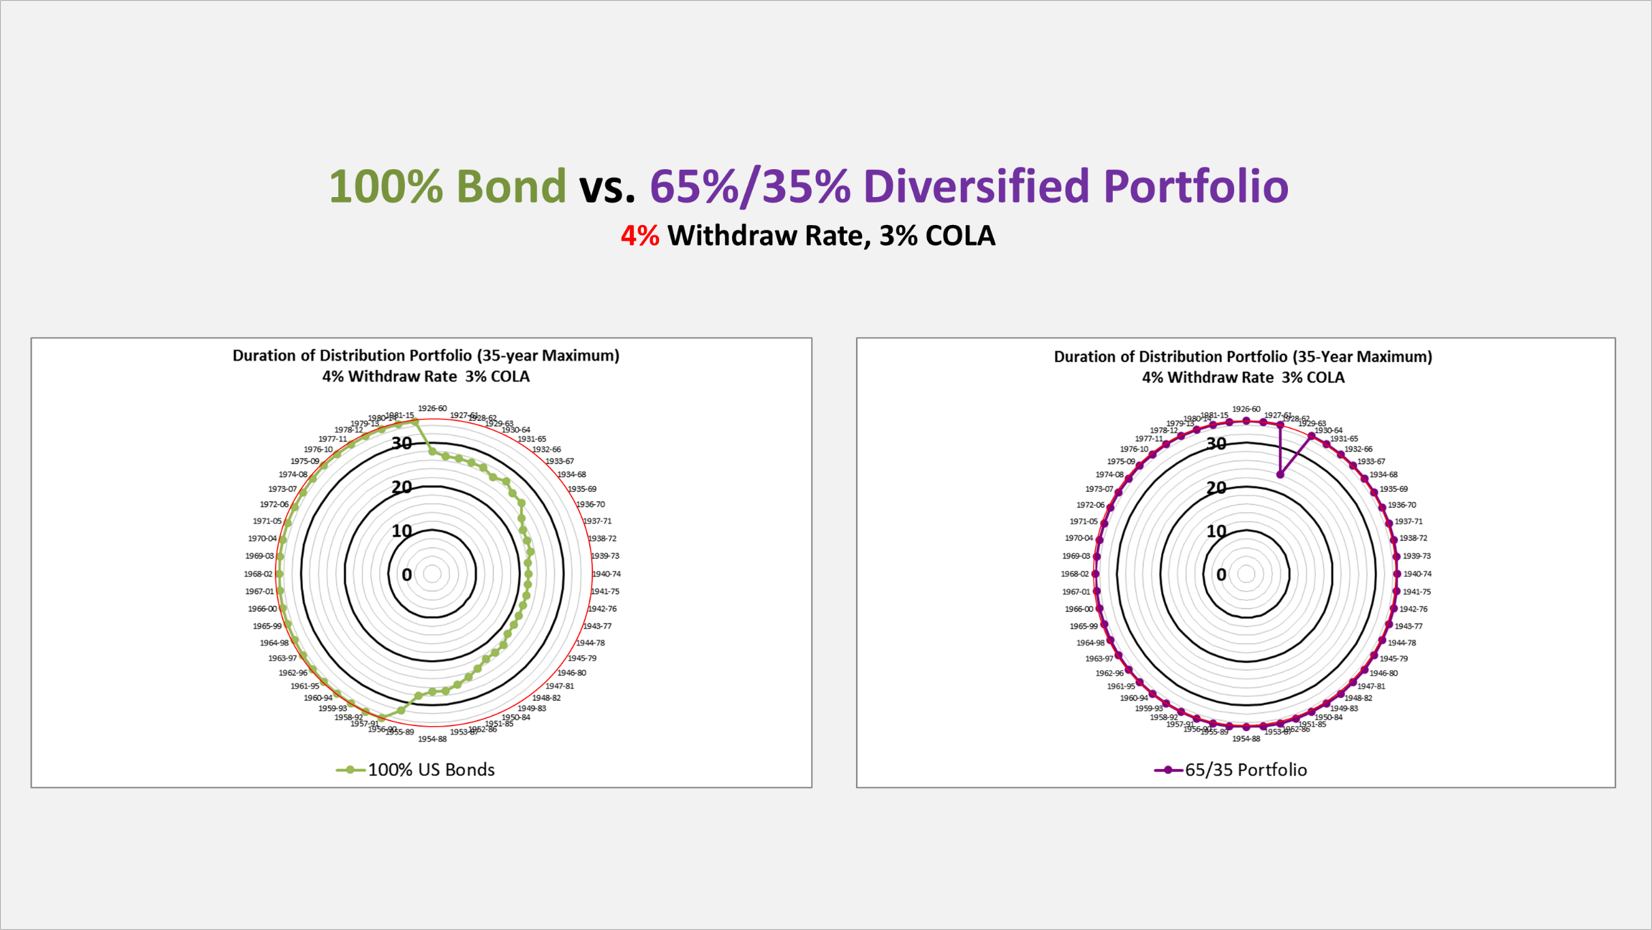
Each dot in green in the all-10-Year U.S. Treasury bond portfolio represents one rolling period in the 35-year lifespan of that portfolio.
Each dot in purple represents one rolling period in the 35-year lifespan of that portfolio, which is 65% in the Standard & Poor's 500 index and 35% in 10-year Treasury bonds. The dots on the outer red ring survived 35 years or longer.
As the dots cave in toward the center, it indicates that during that particular 35-year period, the retirement portfolio lasted less than 35 years. The black circles indicate 30-year, 20-year and less survival periods. Look how many of the all-bond portfolios failed to last 35 years.
Not only are they far from the 35-year survival period but many of the 56 rolling periods lasted less than 25 years. Keep in mind, these two graphs assume an initial withdrawal rate of 4% that is adjusted for inflation by 3% annually.

In contrast, the 65/35 portfolio experienced very little "caving-in" with the same 5% initial withdrawal rate.
Historically, a diversified 65/35 portfolio has been able to survive for at least 35-years far more often than an all-bond retirement portfolio.

But this new data visualization can be helpful in understanding the risk of running out of money in late in life.
If you have any questions or would like to get personal retirement income planning advice, we are here for you any time.
Large cap US stocks represented by Standard & Poor’s 500 Index; small cap US stock represented by Ibbotson Small Stock Index from, 1926-1978 and Russell 2000 Index from 1979-2015; US bonds represented by Ibbotson US Intermediate Government Bond Index from 1926-1975, Barclay’s Capital Aggregate Bond Index from 1976-2015; cash represented by 90-day Treasury Bills from 1926-2015.
© 2024 Advisor Products Inc. All Rights Reserved.
More articles
- Don't Be Victimized By These 10 Common Scams
- Wall Street's Strategists About As Good As Monkeys Throwing Darts
- Stocks Surge 2% Friday But Why Are They So Volatile Lately?
- Getting Ready To Retire? 7 Moves NOT To Make
- Three Ways You Can Play Good Stock Market Defense
- Despite A Lackluster Black Friday, Economic Fundamentals Look Good
- Where's Your Retirement Income Gonna Come From?
- How To Balance The Three Big Saving Priorities
- What Should You Do With That Old 401(k) Account?
- 7 Top Tax Ideas To Use In A Declining Market
- Keep Plugging Away With Your Retirement Plans
- Optimizing A Retirement Portfolio For Taxation
- 10 Steps To Take On The Path To Early Retirement
- Age Is More Than Just A Number In Weighted Plan
- Make Sure That You Comply With All The RMD Rules